Market notes · sample analysis · 2026-08-21
Naples yield, Jacksonville Beach liquidity
The same index can prefer a lower-priced beach town over a gulf estate without pretending either one is a bargain.
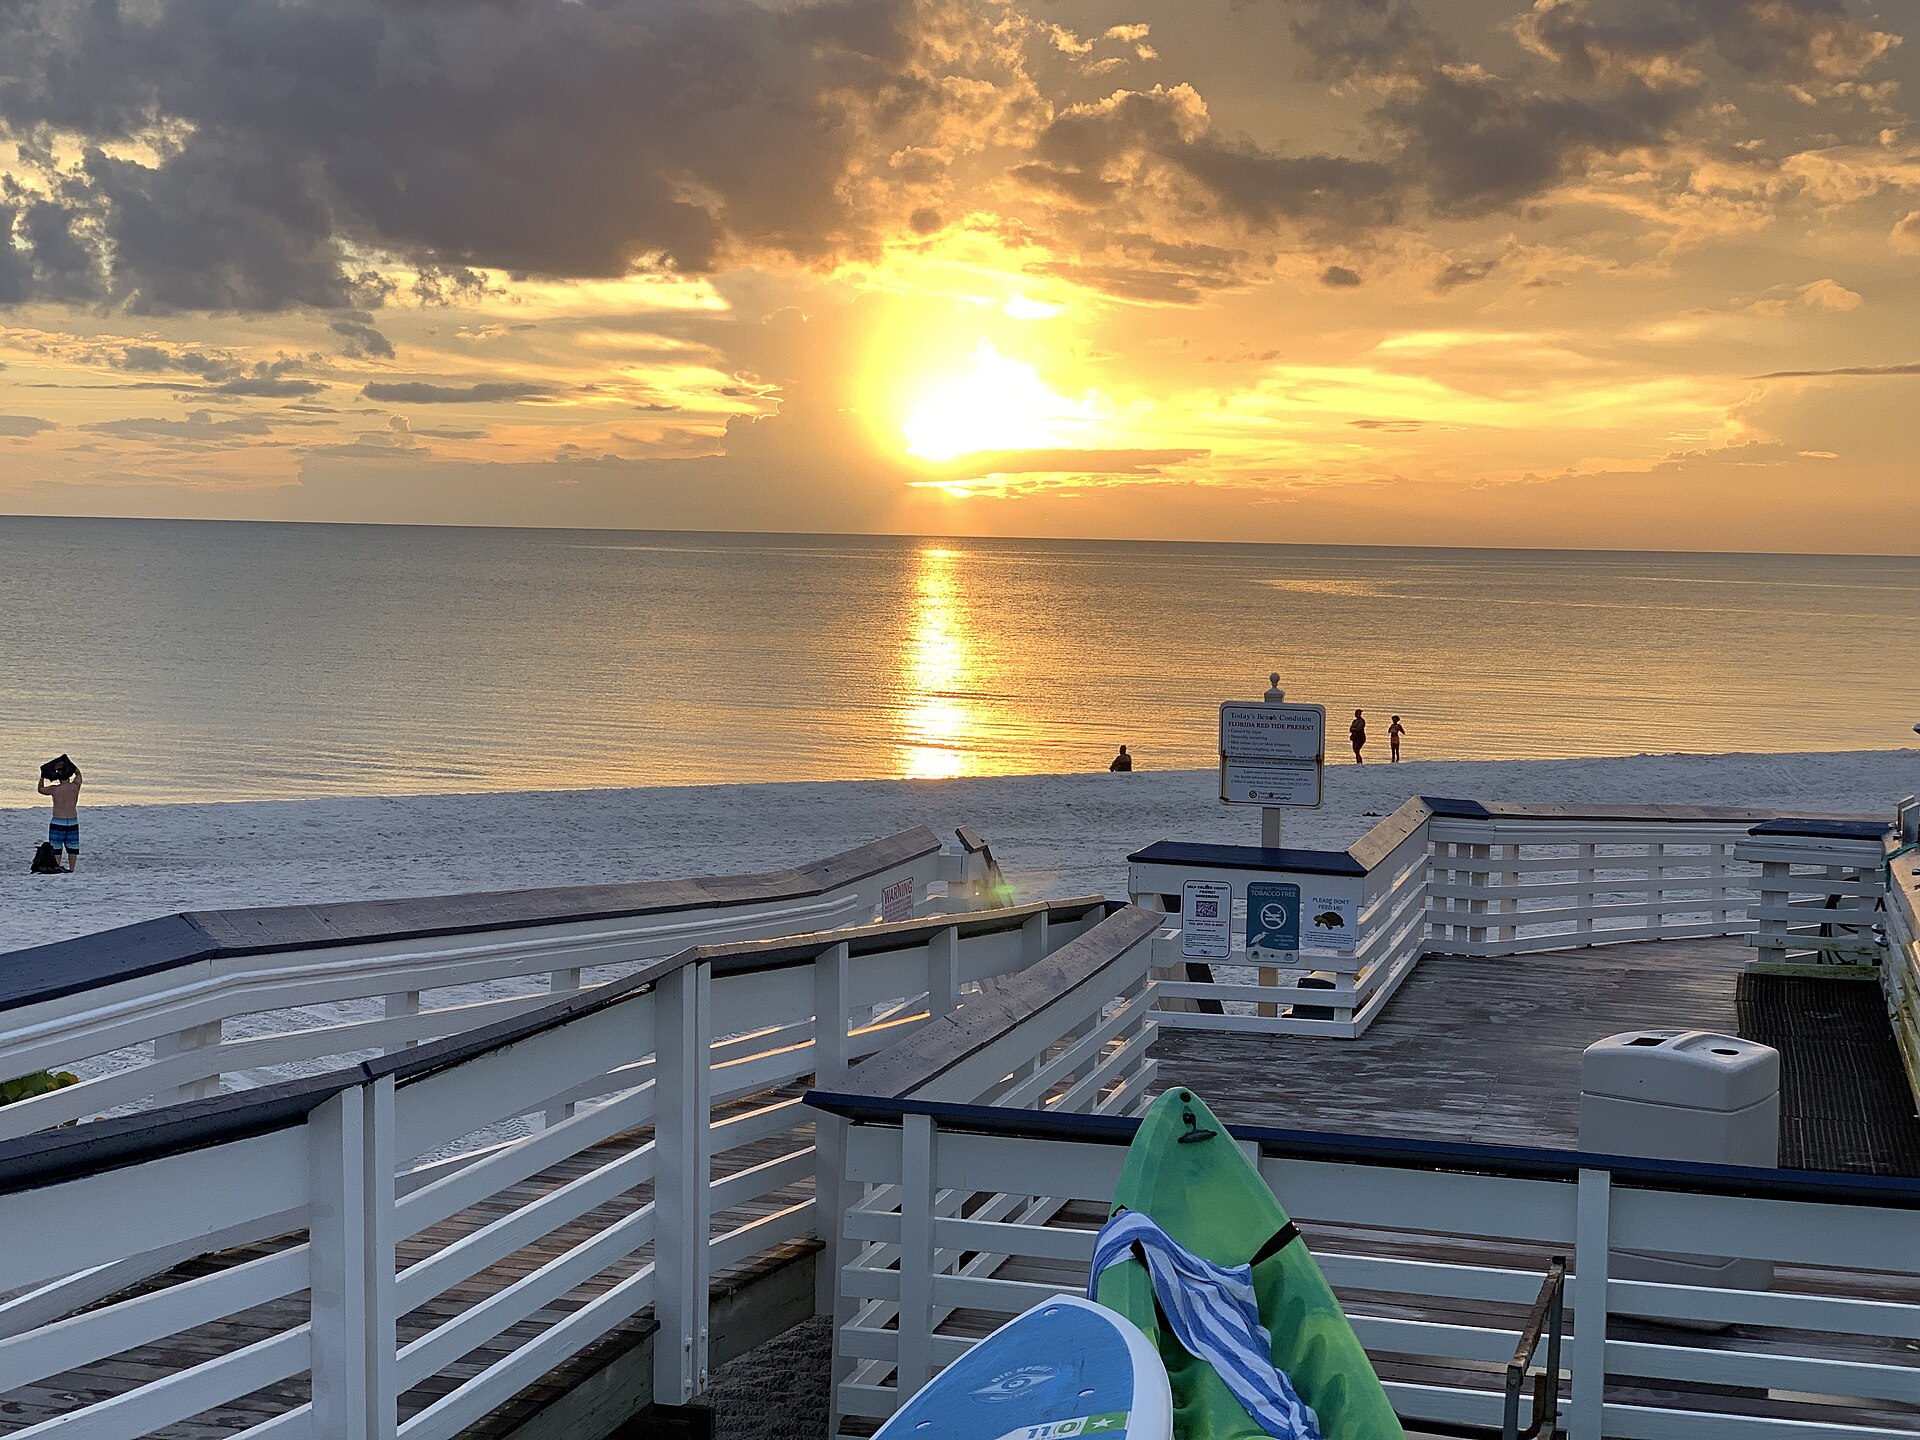
Sunset at Clam Pass, Naples. P,TO 19104. CC BY-SA 4.0. Source
This essay is sample analysis written for the Tiki Realty demonstration. It describes the permanent simulated dataset as of 1 October 2026. It is not a news report, not a forecast, and not advice.
Old Naples Porch is $3.2 million in this set. Lantern House in Jacksonville Beach is $1.145 million. The Naples demonstration median for 2026 is about $2.01 million; Jacksonville Beach is $814,000. Days on market are slower in the Naples baseline than in Jacksonville Beach. Cap rates, using the standard long-term screen, are thinner where the price has run furthest ahead of the stored rent.
The Investment Index notices all of that on purpose. Yield, value versus the city median, liquidity, the one-year constructed appreciation, and the flipped coastal-risk score are weighted 28, 18, 16, 18, and 20. A high price in an expensive city is not automatically punished if it sits under that city's own median. A high price with a thin cap rate and a high coastal score is.
Compare the two cities on the intelligence page before you compare two houses. The city path is the context. The house is a fictional address drawn on top of it.