Market notes · sample analysis · 2026-10-01
How to read a First Coast price path
The Jacksonville Beach line in this set rises hard through 2022 and then flattens. That shape is constructed, and the flattening is the part worth staring at.
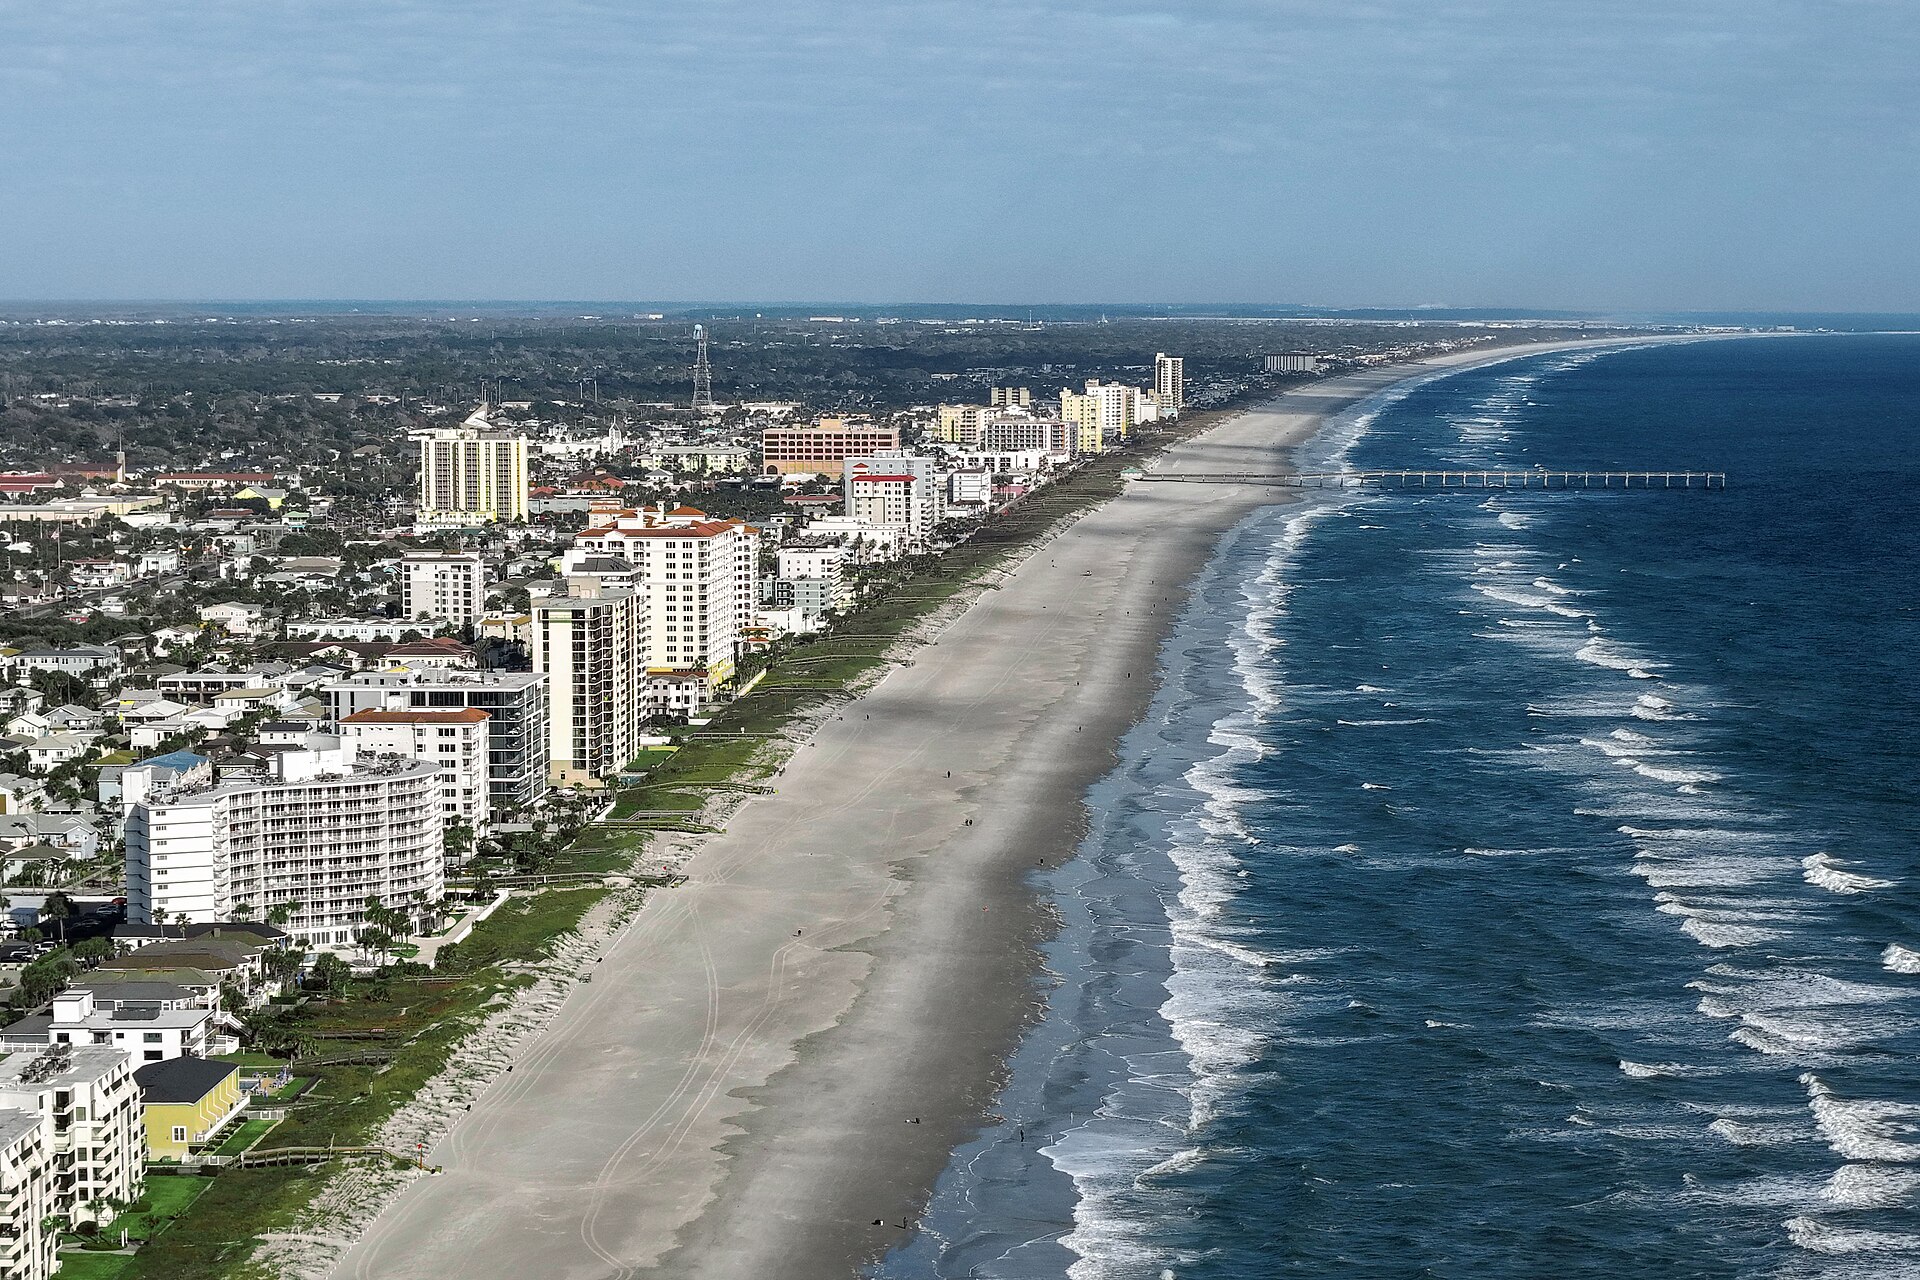
Jacksonville Beach shoreline. Quintin Soloviev. CC BY 4.0. Source
This essay is sample analysis written for the Tiki Realty demonstration. It describes the permanent simulated dataset as of 1 October 2026. It is not a news report, not a forecast, and not advice.
The demonstration median for Jacksonville Beach moves from $465,000 in 2019 to $814,000 in 2026. Most of the climb is packed into 2020–2022. After that, the line adds a little each year and gives a little of the 2022 peak back in 2023. If you only remember the endpoint, you will think the coast is still repricing every season. The path says the violent part of this illustration already happened.
Days on market in the 2026 baseline sit at 48, with 86 homes in the constructed inventory. Neither number comes from an MLS extract. They are anchors so the chart has a scale. Use them to compare Cocoa Beach or Naples inside this same set, not to tell a seller what their street will do.
A useful question, still inside the demonstration, is what a flatter path does to a purchase that only works if the next five years repeat 2021. The finance workbench will run that as an assumption you type in. It will not supply the assumption for you.